
介绍:
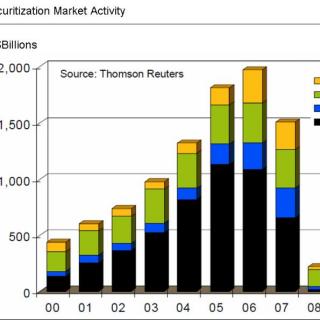
The bar chart shows the securitization market activity from 2000 to 2009. The items here include CDO, ABS, CMBS and RMBS. The figure started at 500 billion dollars and then increased to 2000 billion dollars, before declining to 300 billion dollars at the end of the period. The largest figure can be found in the year 2006, which is 2000 billion dollars, while the smallest figure can be found in the year 2009, which is 100 billion dollars. Overall it is clear that the figures for CDO, ABS, CMBS and RMBS fluctuated widely over the years.
评论 (暂无评论)
暂时没有评论哦,下载荔枝抢沙发吧!
上一期: DI 26 the proportion of UK citizens in different age groups from 1911 to 2011
下一期: DI 28 temperature variations, carbon dioxide and dust concentration thousands of years ago
下一期: DI 28 temperature variations, carbon dioxide and dust concentration thousands of years ago
大家还在听